

Analyzing and Structuring Your Media Image
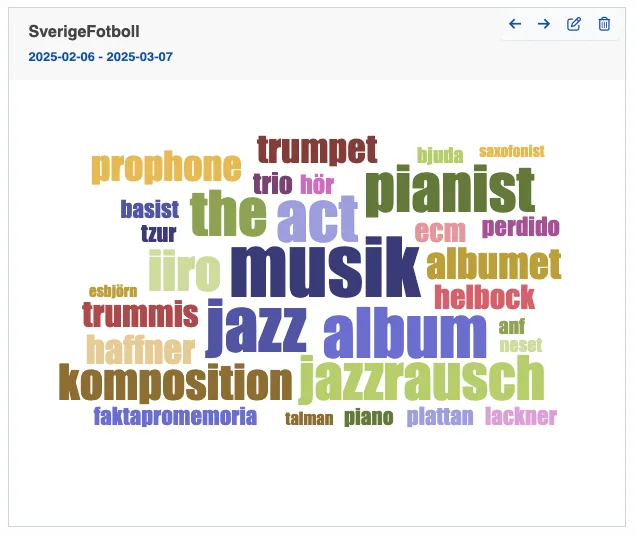
NewsMachine Dashboard is a powerful and user-friendly tool designed to analyze and structure your media image. It offers AI-generated analyses that suggest the sentiment of individual articles and present this information in a clear and pedagogical way. The tool also visualizes key terms through word clouds, making it easier to understand dominant themes in media monitoring.
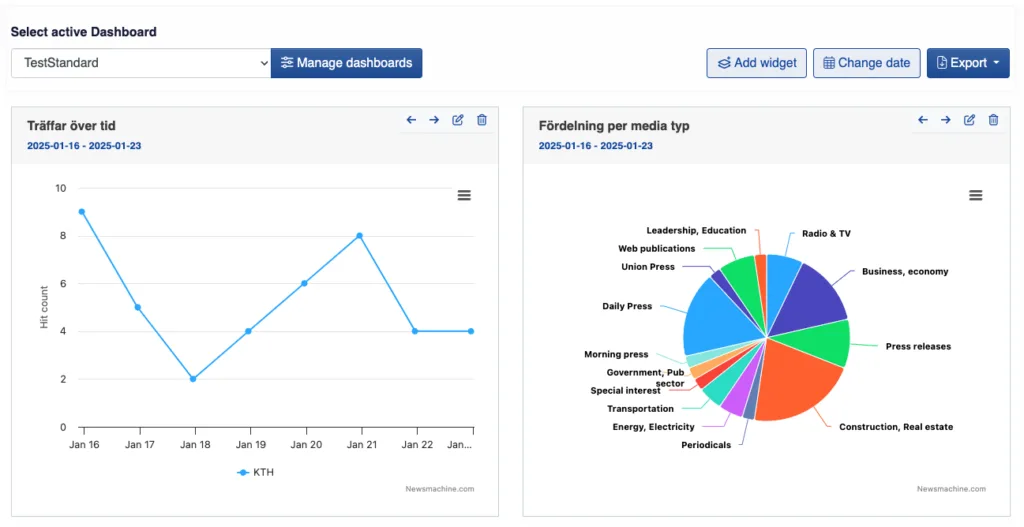
The Dashboard
The Dashboard is where you can analyze results by setting up widgets to display graphs, tables, and other metrics according to your requirements. Available parameters include:
– Chart / Graph
– Text Box (free text)
– Article List
– Table
– Word Cloud (keywords)
– Jumbotron
– Category
– Country
– Language
– Source
– Date
– Tonality
– Reach
– Ad Value
– Edition
– Hour, day, week, month, year
Create a Dashboard
NewsMachine provides various options for creating and exporting analysis reports for agents.
Steps to Create a New Dashboard:
- Click Monitor > Dashboard in the top menu.
- Select Manage Dashboards.
- Click Create New Dashboard.
- You will be given 3 options. Select the one you prefer.
- Enter a Dashboard Name.
- Press Create Dashboard.
Adding New Graphs or Widgets:
- Click Add Widget.
- Select the widget type.
- Select the data source(agent results, saved clips or automatic analysis).
- Customize widget options:
- Select the graph type (e.g. pie chart, bar chart).
- Select the Time Period.
- Add Title & Description.
- Select Data Distribution (agent, country, category, media channel, language, etc.).
- Choose Summarization Metrics (number of hits, reach, ad value, edition).
- Select Grouping Options (time period for summarization).
- Click Save to add the new widget to the Dashboard.
Notes:
– If you have many graphs or images, you may need to scroll down to view newly added widgets.
– You can add an unlimited number of widgets.
Get “Ad Value and Reach” in the Dashboard
- Click Add Widget.
- Select Graph.
- Choose an agent (or multiple for “Share of Voice” analysis).
- By default, graphs display the number of hits over time. You can modify this to display reach, ad value, or edition under “Sum hits on” label instead.
- The system automatically generates graphs based on the selected parameters.
Export of Dashboard
If you have already created a Dashboard, you can easily export it using the export tool.
- Select the dashboard under the Select Active Dashboard tab.
- Enter the start date and end date of the analysis.
- Select the file format ( Word, PDF, PowerPoint, Excel ). and download the file from the Export tab.
The key difference between Word and PDF exports is that Word includes all data and hits, while PDF exports only what is visible on the screen.
Note: If any agent searches are incomplete, a warning will appear with suggestions. For example, if you’re analyzing data from 2018 but only have reverse search results from 2019, you must redo the search and wait for completion.
For inquiries questions, do not hesitate to contact us!